The Art and Science of Chart Selection
Choosing the right chart type is crucial for effective data communication. The wrong visualization can obscure insights or mislead your audience, while the right one illuminates patterns and drives understanding.
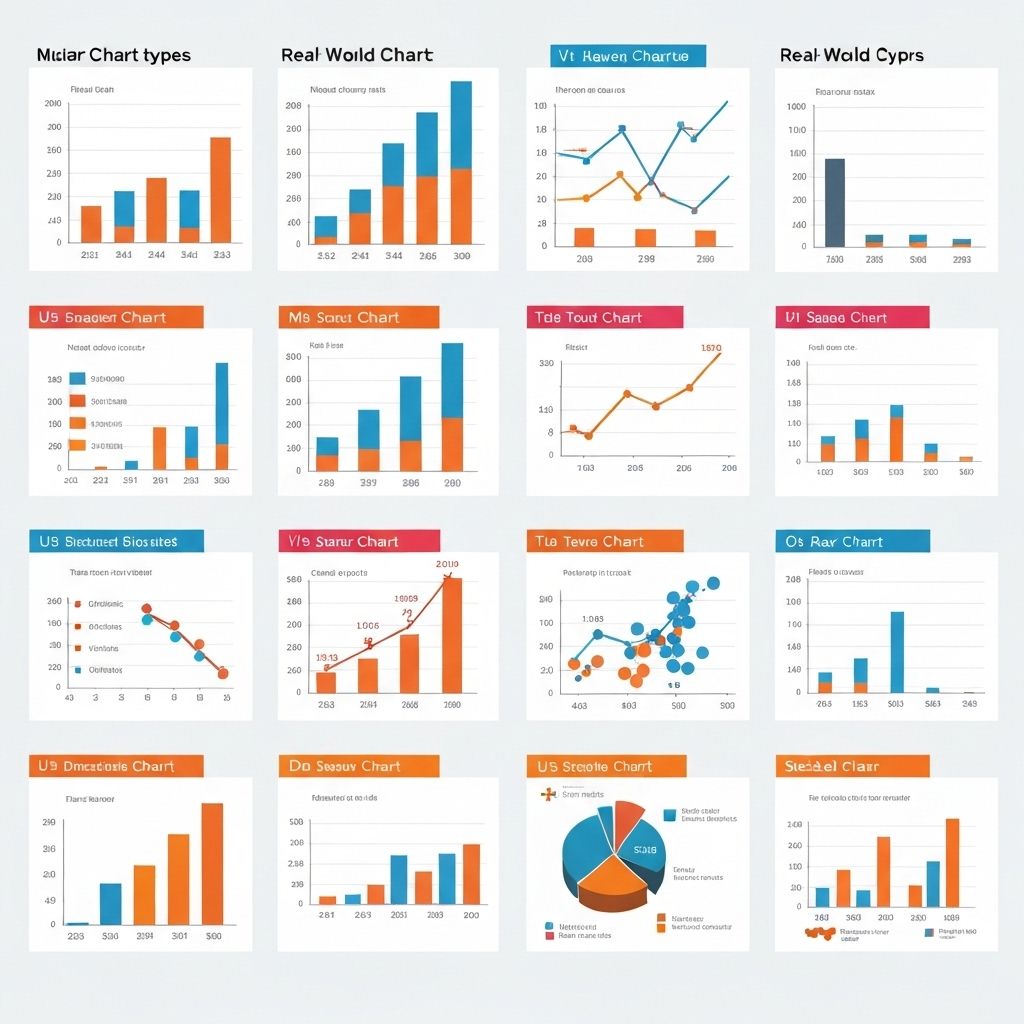
Bar Charts: The Workhorse of Data Viz
Bar charts excel at comparing discrete categories. Use them when you need to show differences between groups, track changes over time with distinct periods, or rank items by value. They're intuitive and work well for both small and large datasets.
Line Charts: Showing Trends Over Time
When your data has a continuous dimension like time, line charts are your best friend. They clearly show trends, patterns, and changes, making them ideal for time series data, stock prices, or any metric tracked over regular intervals.
Pie Charts: Use Sparingly
Despite their popularity, pie charts have limitations. They work best for showing parts of a whole when you have 3-5 categories. For more complex data, consider alternatives like stacked bar charts or treemaps.
Scatter Plots: Revealing Relationships
Scatter plots are powerful for showing correlations and distributions. Use them to identify patterns, outliers, and relationships between two continuous variables.